Checks
Read results
After you add a check, the list and detail page show stored samples.
The list
Title: API checks or Website checks. Empty copy: Add a public URL. The engine probes it from San Francisco and stores uptime samples.
Toolbar: Search (name and URL), status filter (All checks, Up, Down, Paused), and a 24 hours label.
Columns:
- Site — name and URL (opens detail)
- Status — Up, Down, Paused, or Waiting
- Uptime — 40-tick bar for the last 24 hours
- Last checked — relative time, or —
- ⋯ menu — Open, Run now, Pause / Resume, Delete
The list refreshes on its own (about every 15 seconds; faster while a status is still pending). More than 20 checks paginates.
The detail page
Open a check at /app/checks/{api|website}/{id}.
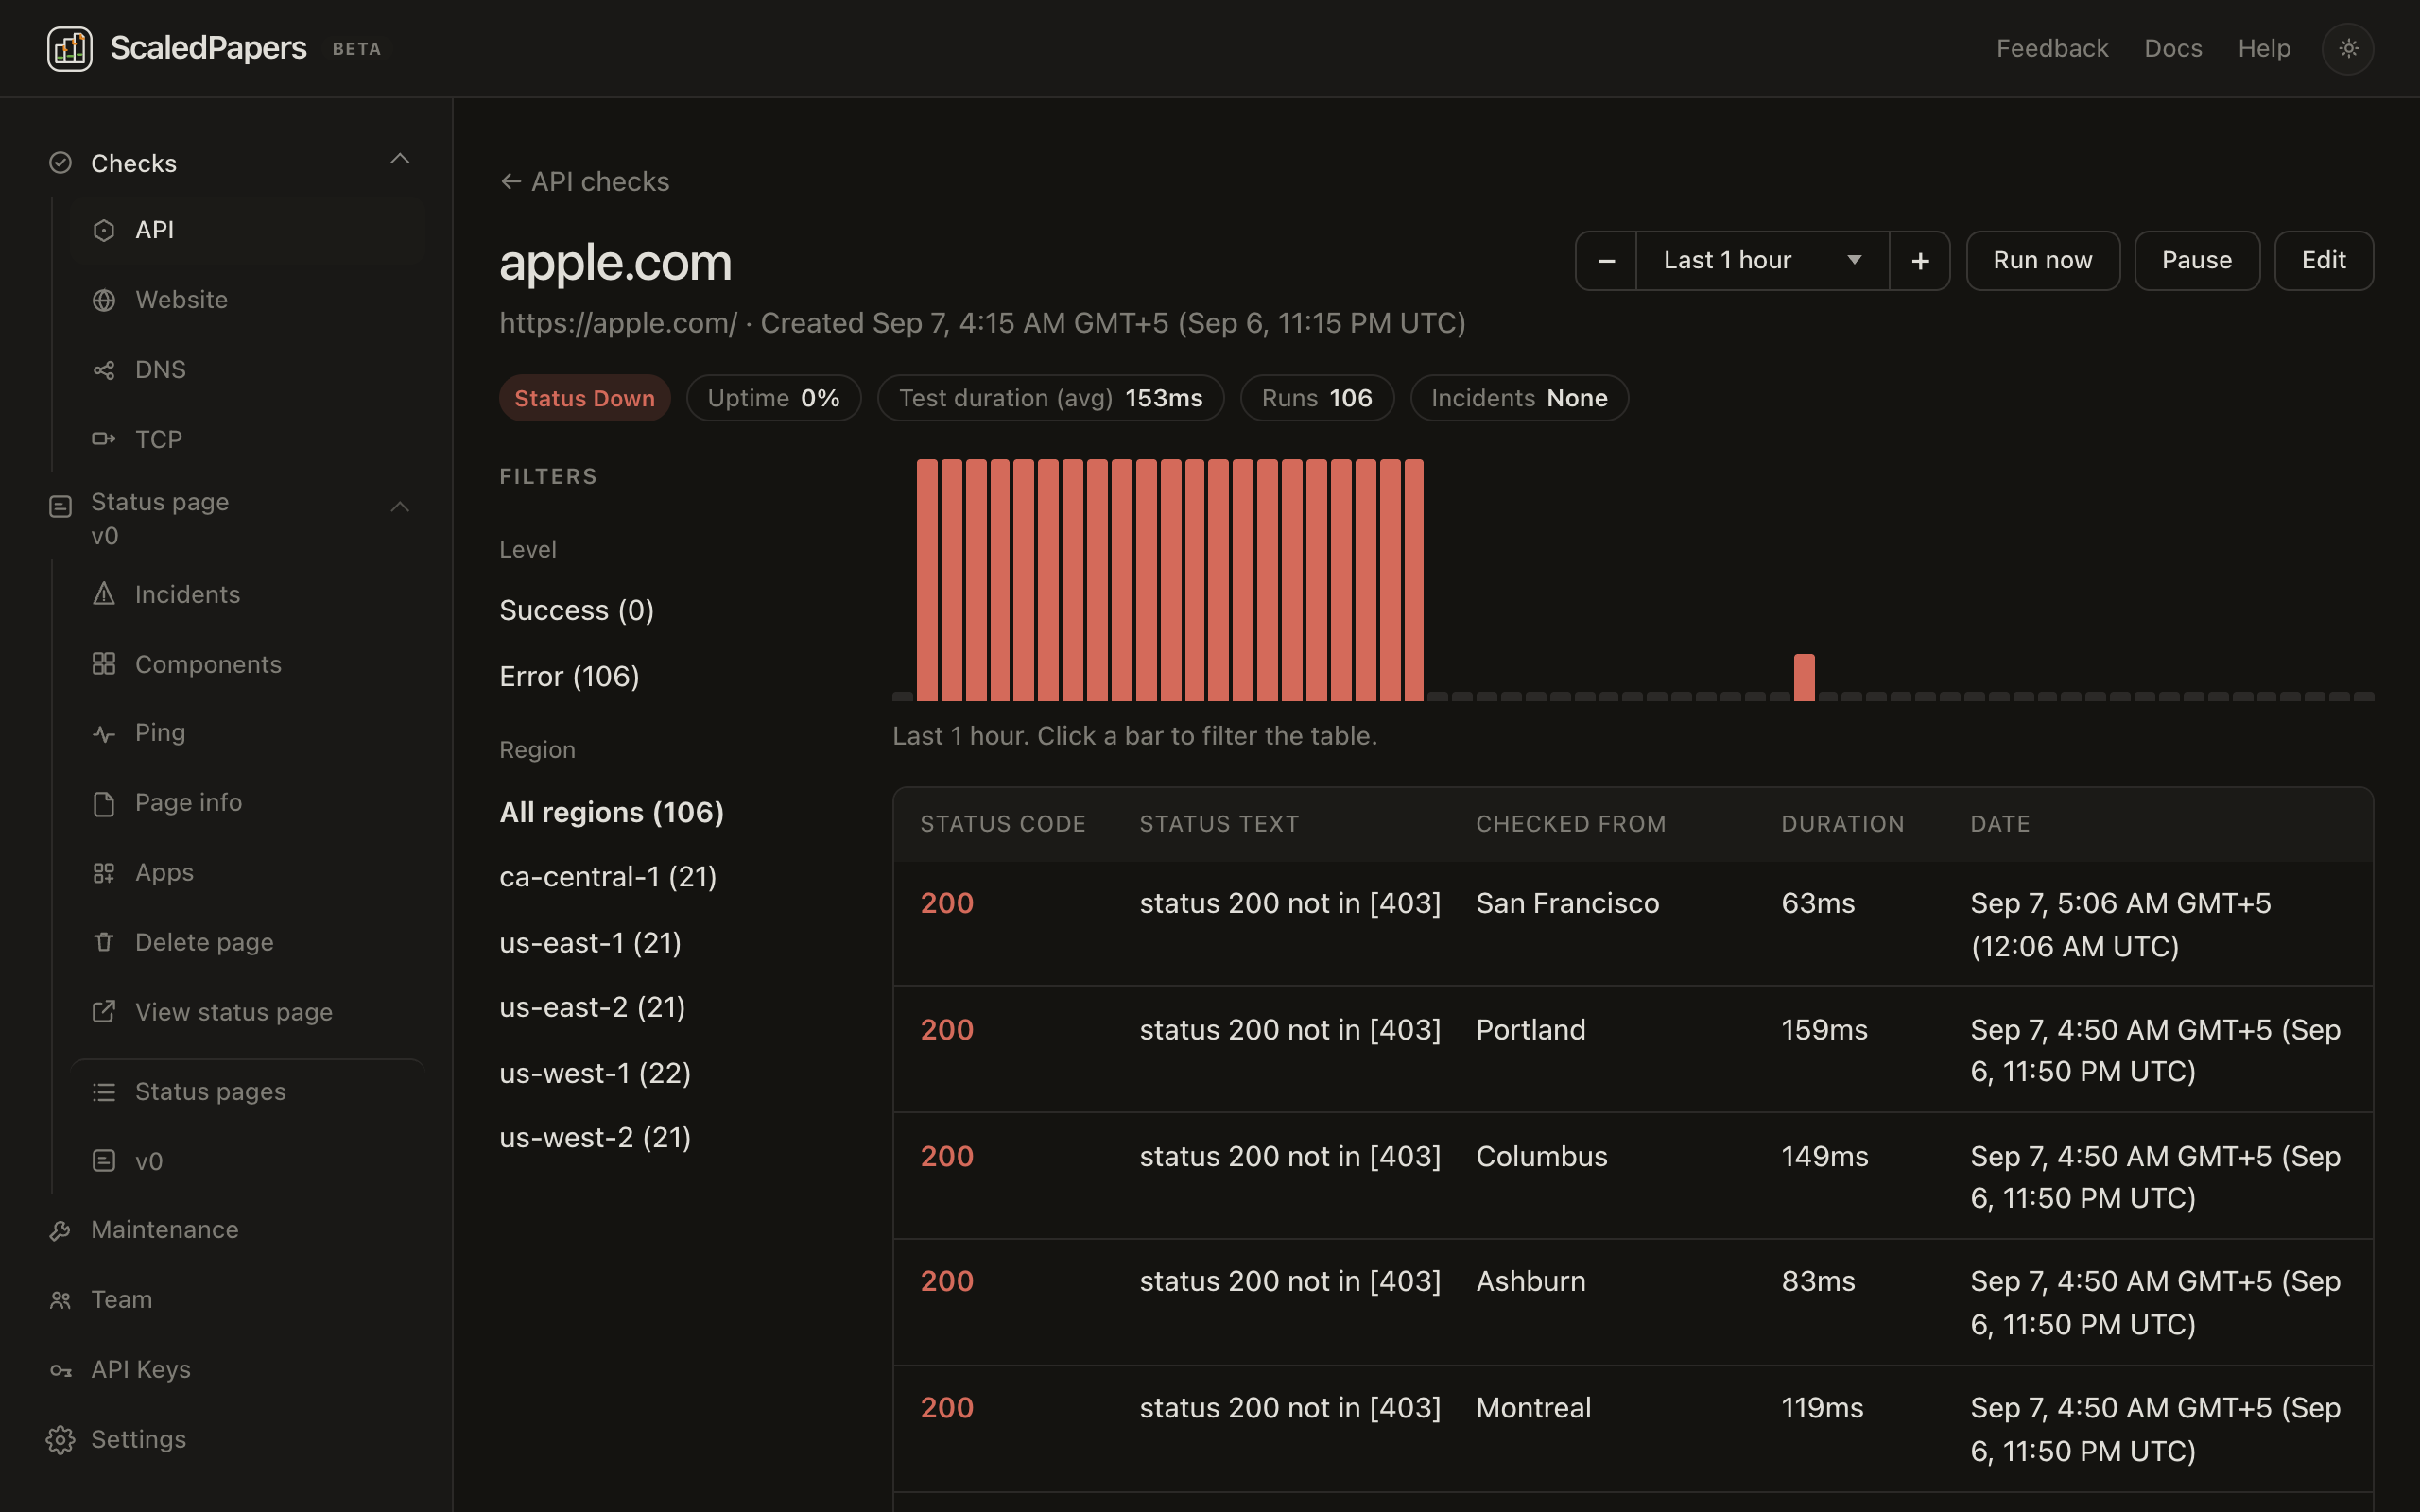
Header:
- Time range: Last 15 min, 30 min, 1 hour (default), 3h, 6h, 12h, 24h, 2 days, 7 days. − / + zoom. The choice is remembered in this browser.
- Run now — fires one probe immediately
- Pause / Resume — stops or starts the schedule
- Edit — same form as create, inline (including Status page linking)
Metrics: Status, Uptime percent for the window, Test duration (avg), Runs, Incidents in the window (or None).
Filters: Success / Error, and All regions plus each city that appears in samples.
Chart: bars for up / down / empty buckets. Hover for counts. Click a bar to filter the samples table.
Samples (up to 100 rows): Status code, Status text (Passed / Failed / error), Checked from, Duration, Date in your timezone. The table refreshes about every 15 seconds while the page is open.
Checks vs the homepage checker
Use a Check when you want a URL watched while you are away. Use the website checker for a one-off “where is it down?” from 16 regions, including Europe and Asia.